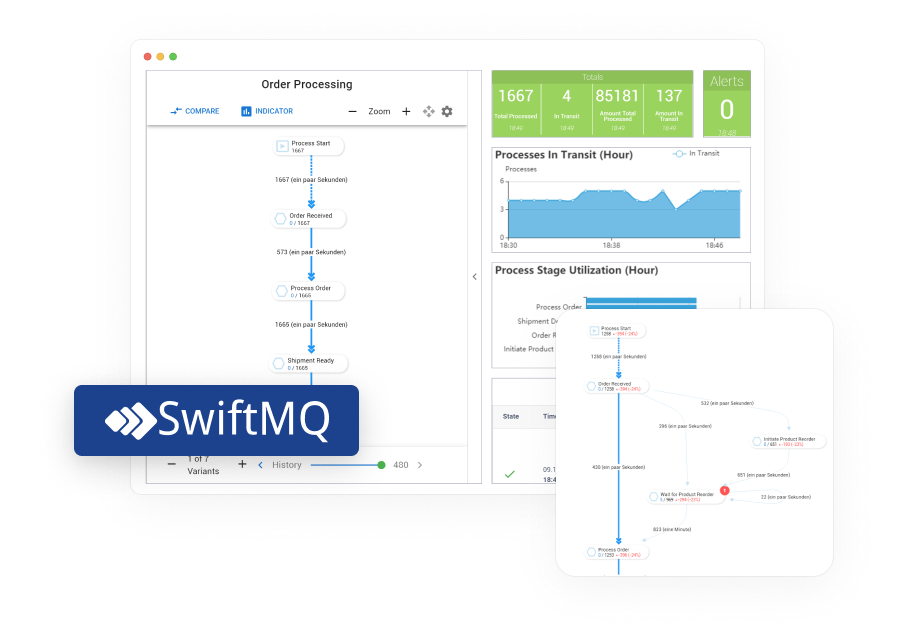
Smart Apps for Realtime Process Monitoring
Process Monitoring & Automation in Realtime for SwiftMQ in Minutes!
- Monitor and discover inefficiencies in your business processes.
- Follow your business processes through their whole life-cycle in realtime.
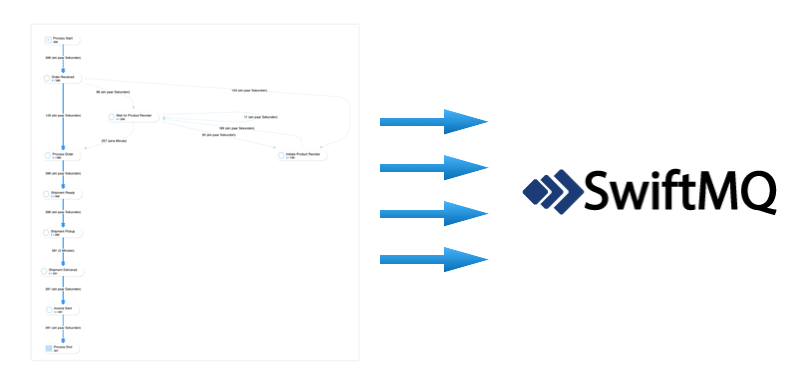
- Receive events from SwiftMQ topics and let the app build a dynamic Process Model.
- Visualize it in a Process View, identify bottlenecks, get alerted, take automatic actions.
- Benchmark the live process against a 10 days history.
- Automatically send events from the Process Model to SwiftMQ topics and implement automation.
- No coding! Walk through a simple setup wizard, and it works autonomously.
- Runs on the highly scalable Flow Director microservice platform.
- Deploy it on-premise or in the cloud.
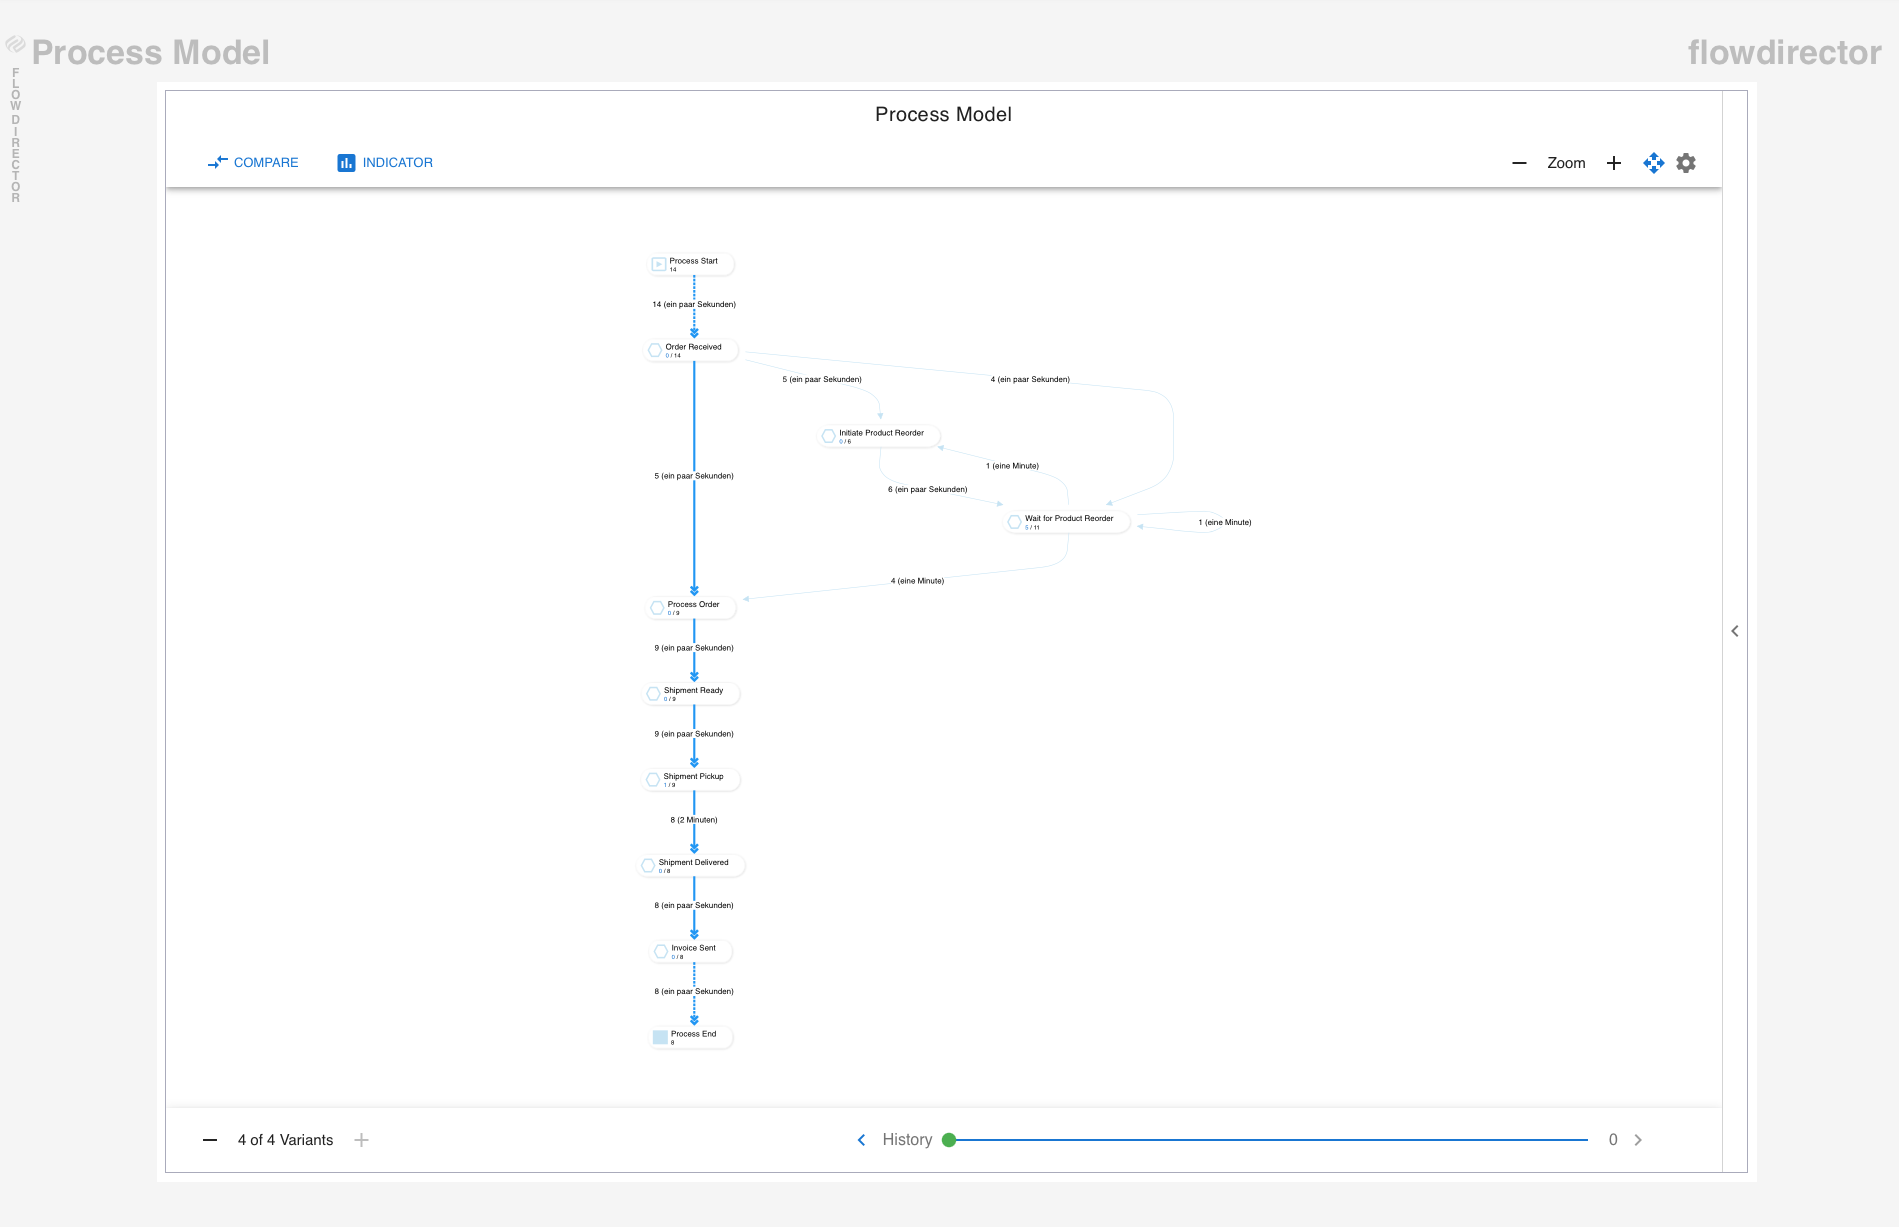
Process View
The center of this app is the process model, which computes in real-time from the events flowing into this app. It shows you an aggregated view of all instances of your business processes. You see the optimal path (happy path) as well as all deviations from it.
Switch between the total count and the value of events. The app takes snapshots every 15 minutes and stores them in history for up to 10 days. Compare the live model against a snapshot in history or any two snapshots. You can do this also in a rolling manner like yesterday, same time, or last week, same day/time.
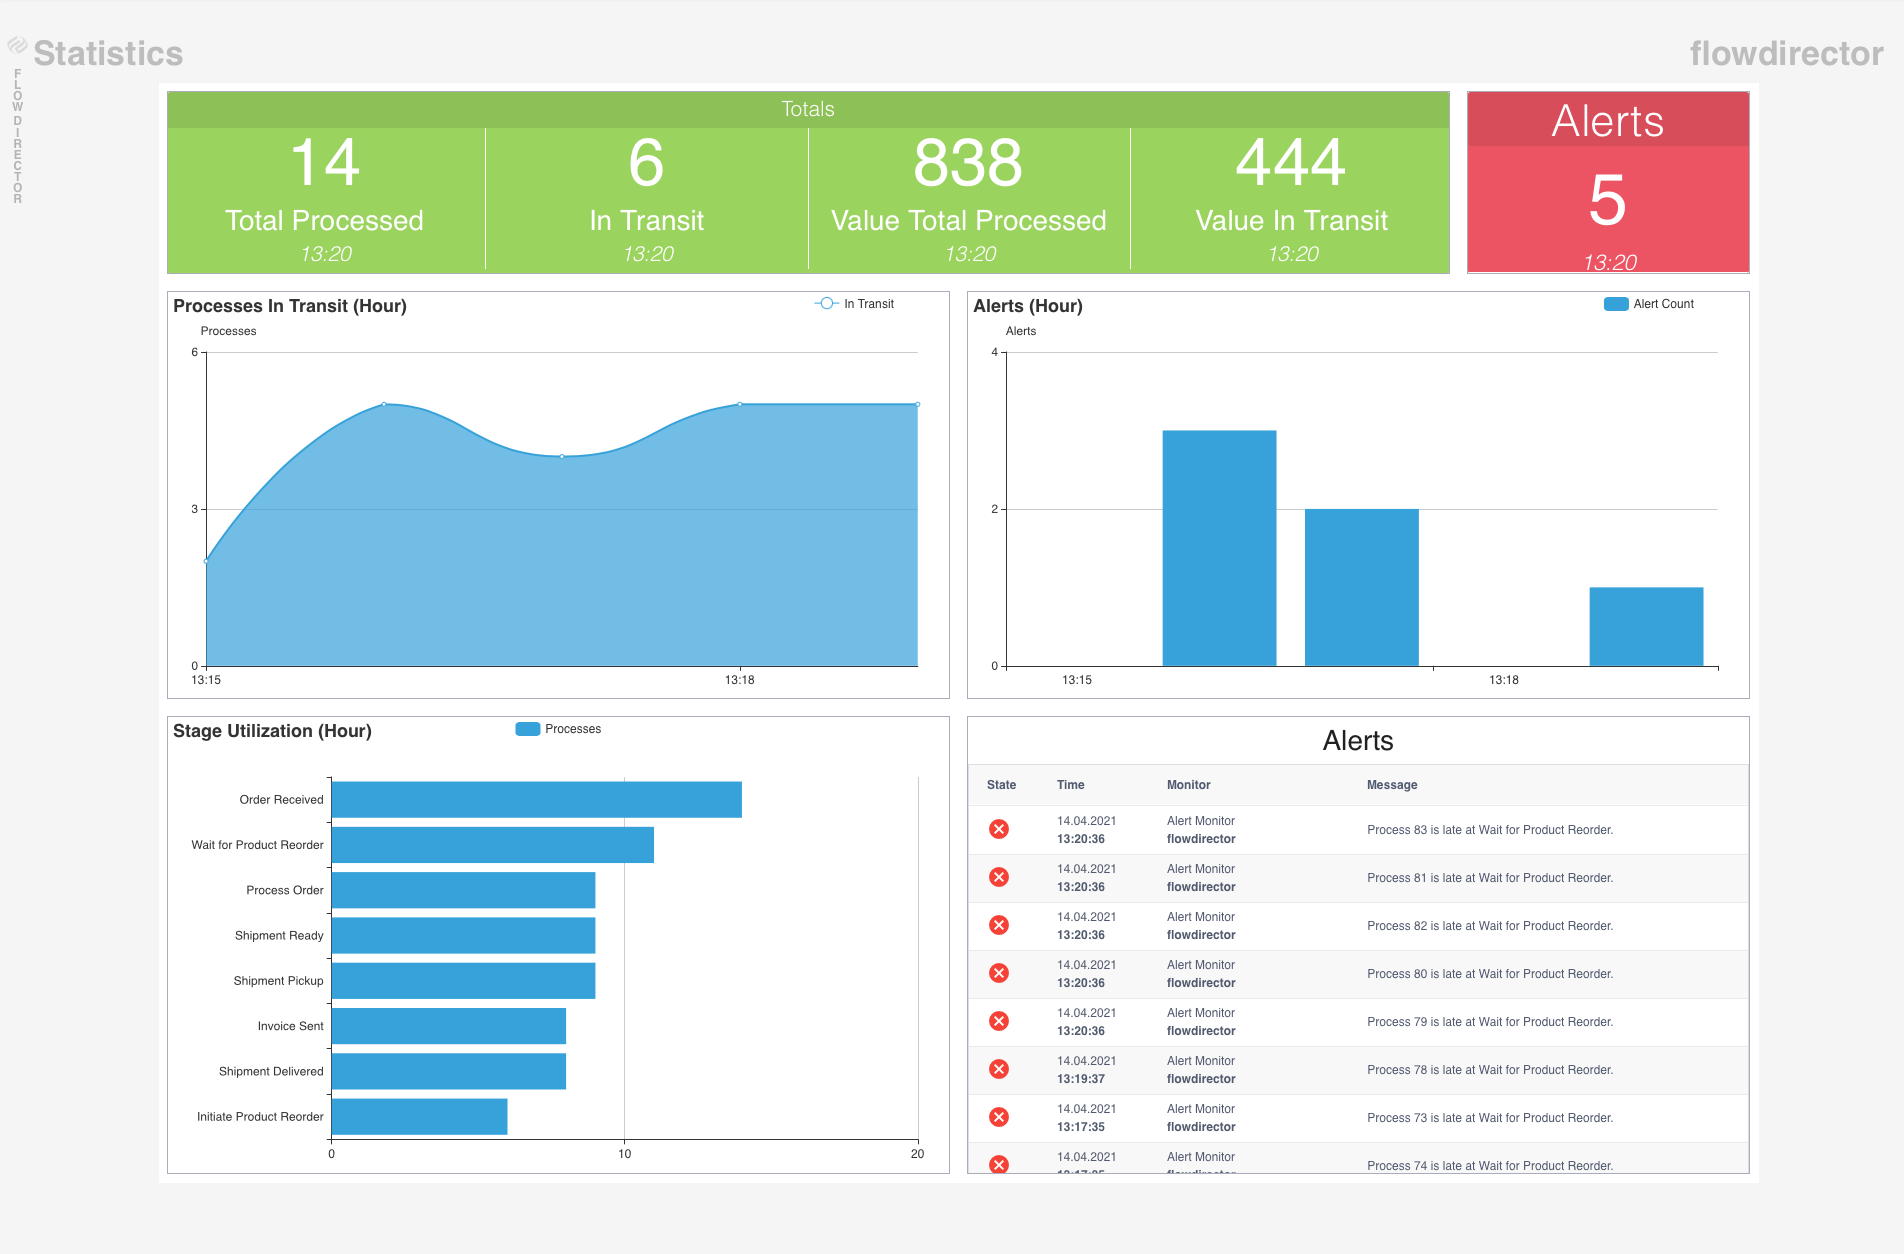
Statistics
The app displays live statistics like totals, in transit, and current alerts. Other charts display the processes in transit, the utilization of stages, and the alerts of the present hour, plus the last 100 alerts.
Further history charts contain statistics for the present hour, day, month, and year.
Automation
Consider the process model as the brain of your application as it contains all relevant data and states.
Define events and alerts for all kinds of state changes in the process model and send them to outbound SwiftMQ topics so that you can automate further actions directly from the process model.
30 Days trial without registration!
After installation and login to this app, you can opt to start a trial for 30 days without registration. So you have plenty of time to test it. Technical support is included.
Ready to purchase?
We offer a Flow Director App license at a very moderate monthly and yearly subscription rate with technical support included.
Buy a license